Discovering the oddity
The M1 Max is a phenomenally powerful peice of kit, but can it write almost 300GB of data to memory in one second? Let’s answer that question with some system performance and Python profiling exploration.
I was running through Julia Evans’ computers-are-fast.github.io quiz and got to the question asking how many bytes can be written to memory in just one second. Having memorized ‘napkin math’ system performance numbers I knew that sequential memory R/W throughput is on the order of 10GB/s on fast machines. Taking that into consideration I correctly guessed the biggest option, 1,000,000,000 bytes. (The exact result on the quiz author’s older laptop was 2GB/s.)
Interested in how my new Macbook M1 Max would fare, I converted the provided write_to_memory.py code to Python 3 and tested it.
from io import StringIO
CHUNK_SIZE = 1_000_000
s = "a" * CHUNK_SIZE

def f(NUMBER):
    output = StringIO()
    bytes_written = 0
    while bytes_written < NUMBER:
        num_written = output.write(s)
        bytes_written += CHUNK_SIZE
import sys
f(int(sys.argv[1]))
Running this snippet to write 2GB took not one second but a remarkable 40ms. I thought, shit, just how fast is this machine? Suspiciously fast. Sequential memory write throughput is fast these days, but not that good. I wondered: how fast does this snippet run on 100GB?
And that’s how I found a giant performance wall in the code.
time python3 write_to_memory.py 99_000_000_000 ... 0.361s total
time python3 write_to_memory.py 100_000_000_000  ... 28.526s total
Writing 99GB to memory took ~350ms, impossibly fast, and writing 100GB took 30 seconds, around 80x slower. What gives?
Initial debugging
This kind of blow up was dramatic and initially unexplainable. It wouldn’t have been in the spirit of the quiz to shrug and move on, so I stopped and began spelunking in the deeper layers of this short code snippet.
plasma-umass / scalene
The first tool I reached for was Scalene, a new and shiny Python profiler. Profiling the snail-pace 100GB run showed a few interesting things:
- Essentially zero time was being spent executing
.pycode. Most execution time was in “native” code (C code) and “system” (most likely I/O) - Scalene’s
COPY (MB/s)column was calling out that the program was copying about 3.4GB of memory a second. 100GB divided by 3.4GB/s memory copy bandwidth gives approximately the program’s execution time of 28.1 seconds. - Peak memory usage was 95.36 GiB (102.39 GB), which accords with expected program behavior.
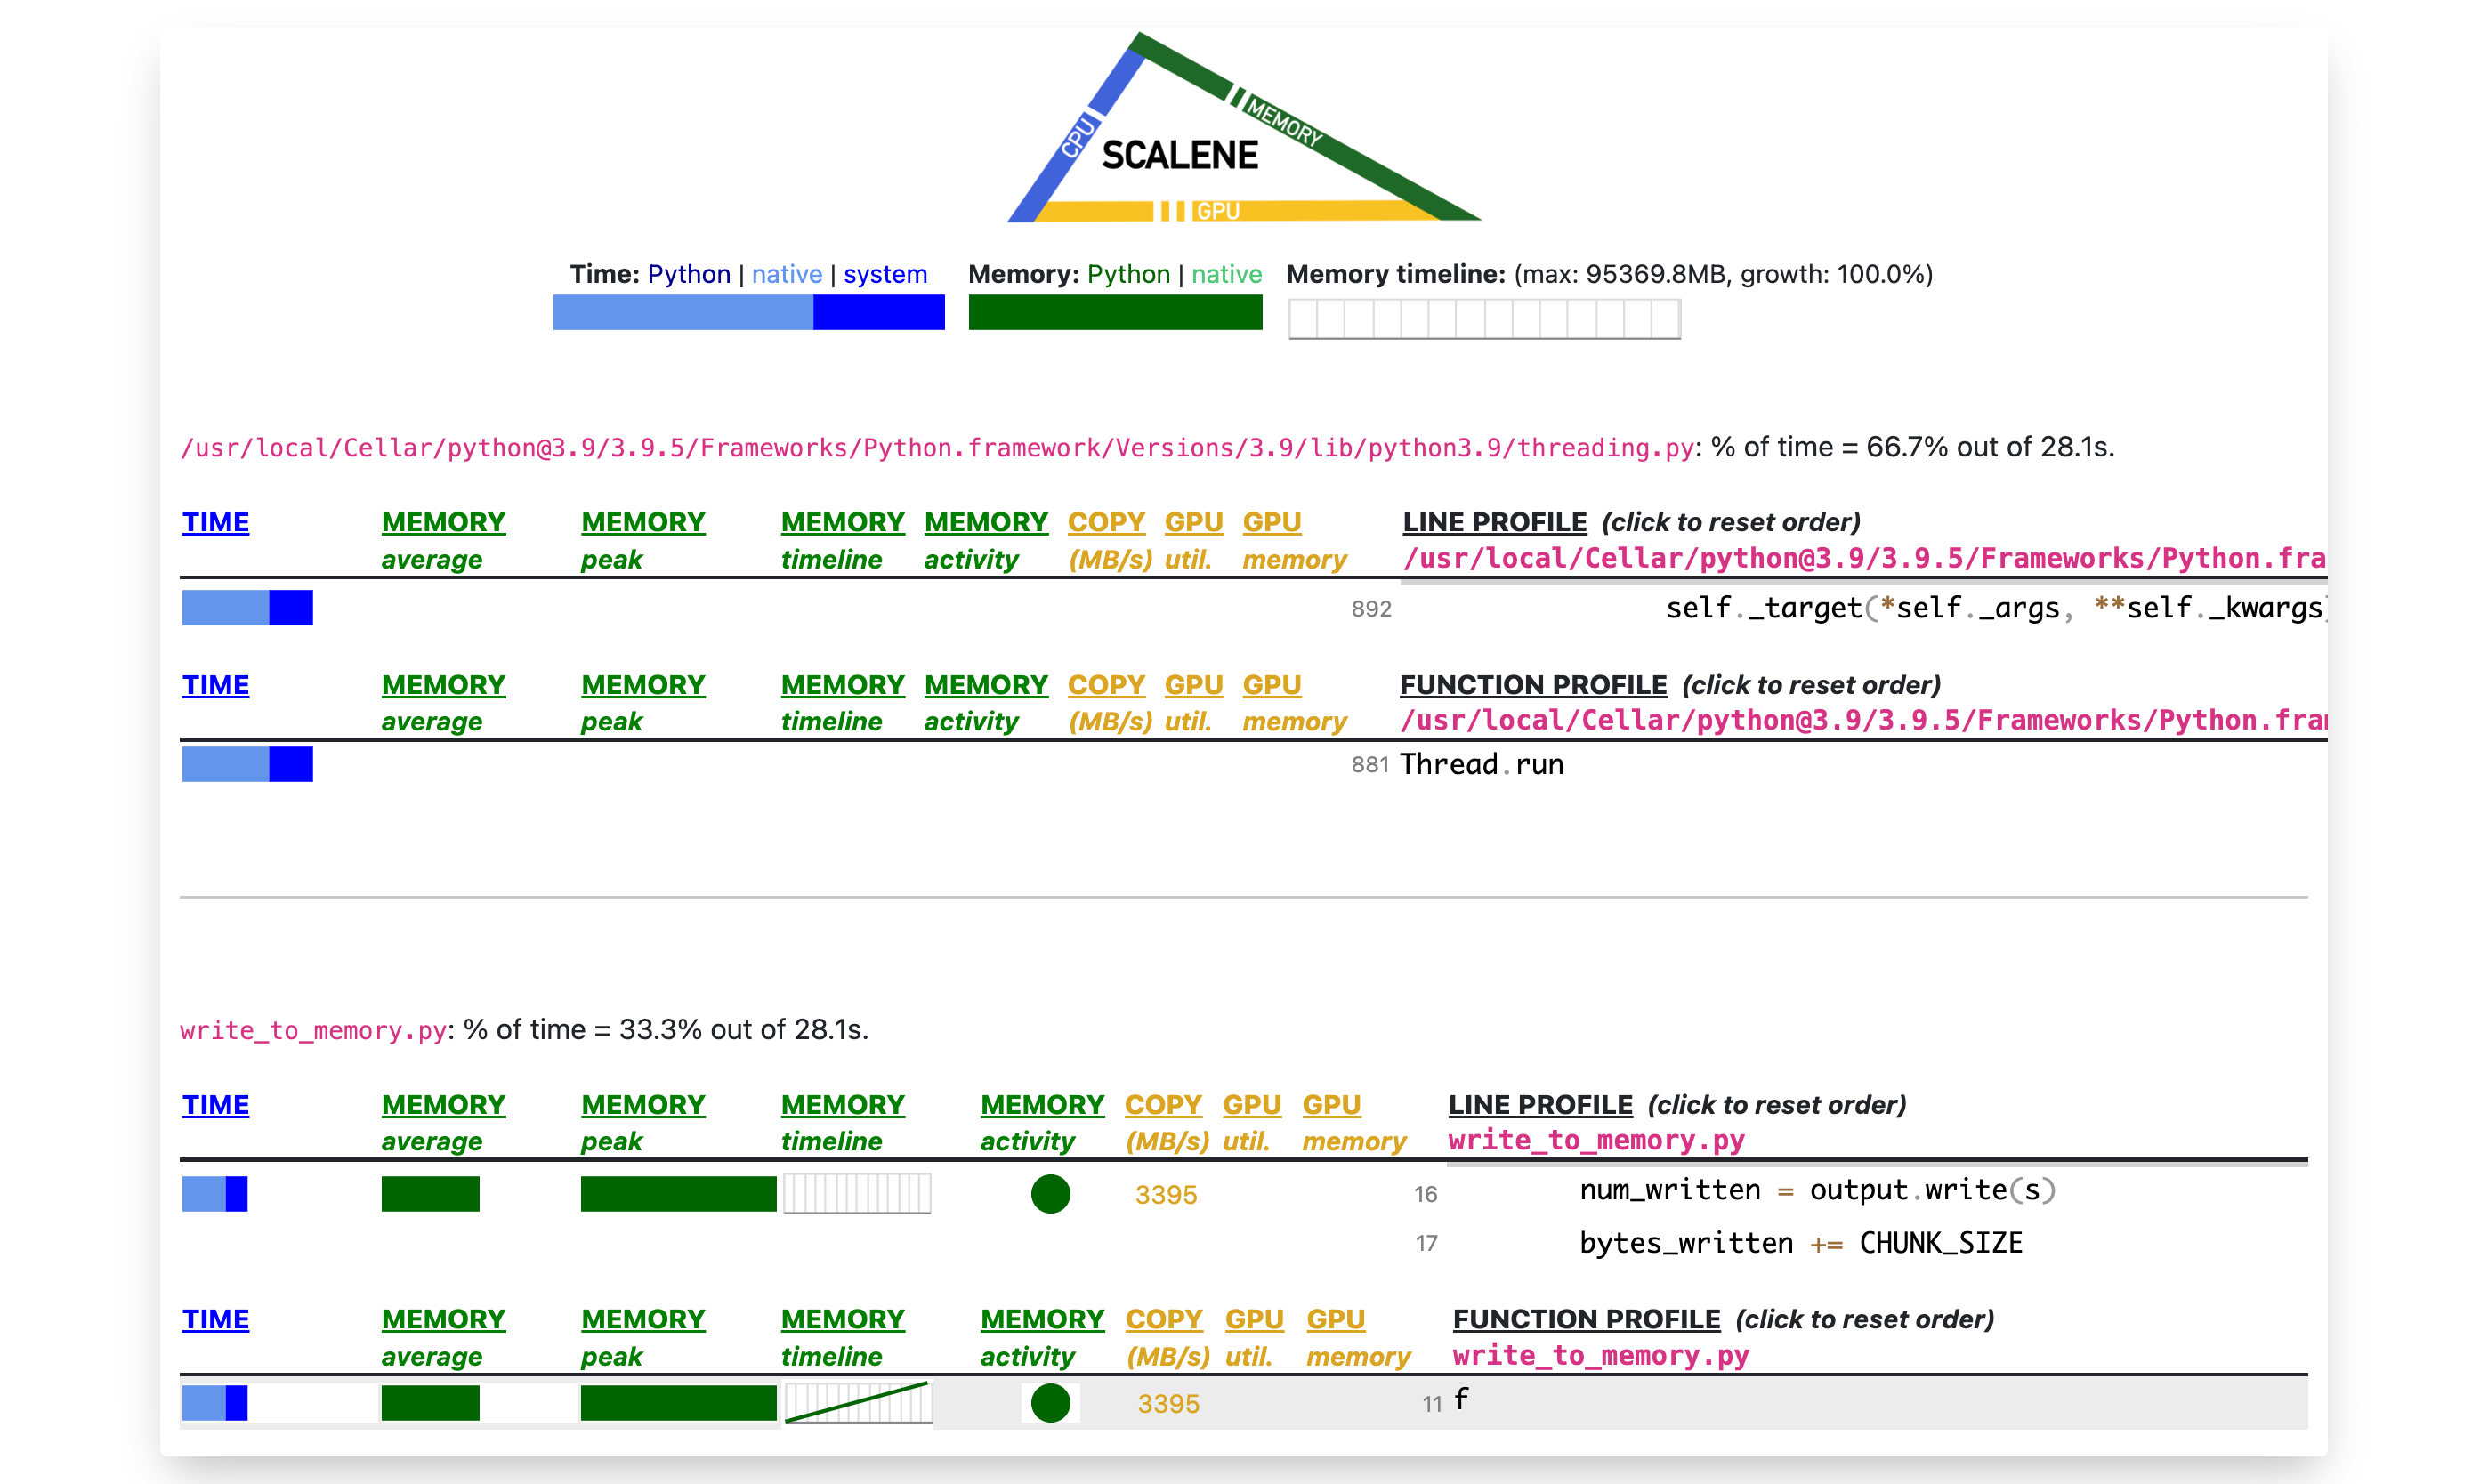
When running Scalene on write_to_memory.py 99_000_000_000 (GUI results not pictured), I could see why it was finishing so fast. Memory usage was minimal, <2MB. This program wasn’t actually writing 99GB to memory; the first clue.
Good ol’ print() debugging.
I was curious to know more precisely where the snippet’s data writing while loop was hitting a performance wall, so I added print(f"Written {bytes_written:_} bytes") and re-ran python3 write_to_memory.py 100_000_000_000.
The program hung at 100_000_000_000 - CHUNK_SIZE == 99_999_000_000 bytes.
Interestingly, if I reduced CHUNK_SIZE to 100KB from 1MB, the program hung 10 times. This seemed to suggest that the performance degradation was related not to amount of memory written but the number of writes issued. If this was correct, then progressively reducing chunk size by a factor of ten should increase .write(s) operations and number of stalls by a factor of ten.
This is what happened, and stalls at smaller chunk sizes were also shorter. I had my second clue.
Instruments 🔬
scalene was helpful but it wouldn’t be able to show me what exactly was happening in the CPython interpreter’s C code, so I reached for another profiling tool. Being on a Macbook M1, I fired up the OSX Instruments app’s Time Profiler, which “performs low-overhead time-based sampling of processes running on the system’s CPUs”.
I started recording within Instruments and ran the snail-pace python3 write_to_memory.py 100_000_000_000 command. After the process finished, in around 30 secs, I stopped the recording and created a new recording run for python3 write_to_memory.py 99_000_000_000.
It did not take long to spot the issue. Here’s an image of the slow run, showing a very slow function call named flush_accumulator that was completely absent from any fast run I profiled:
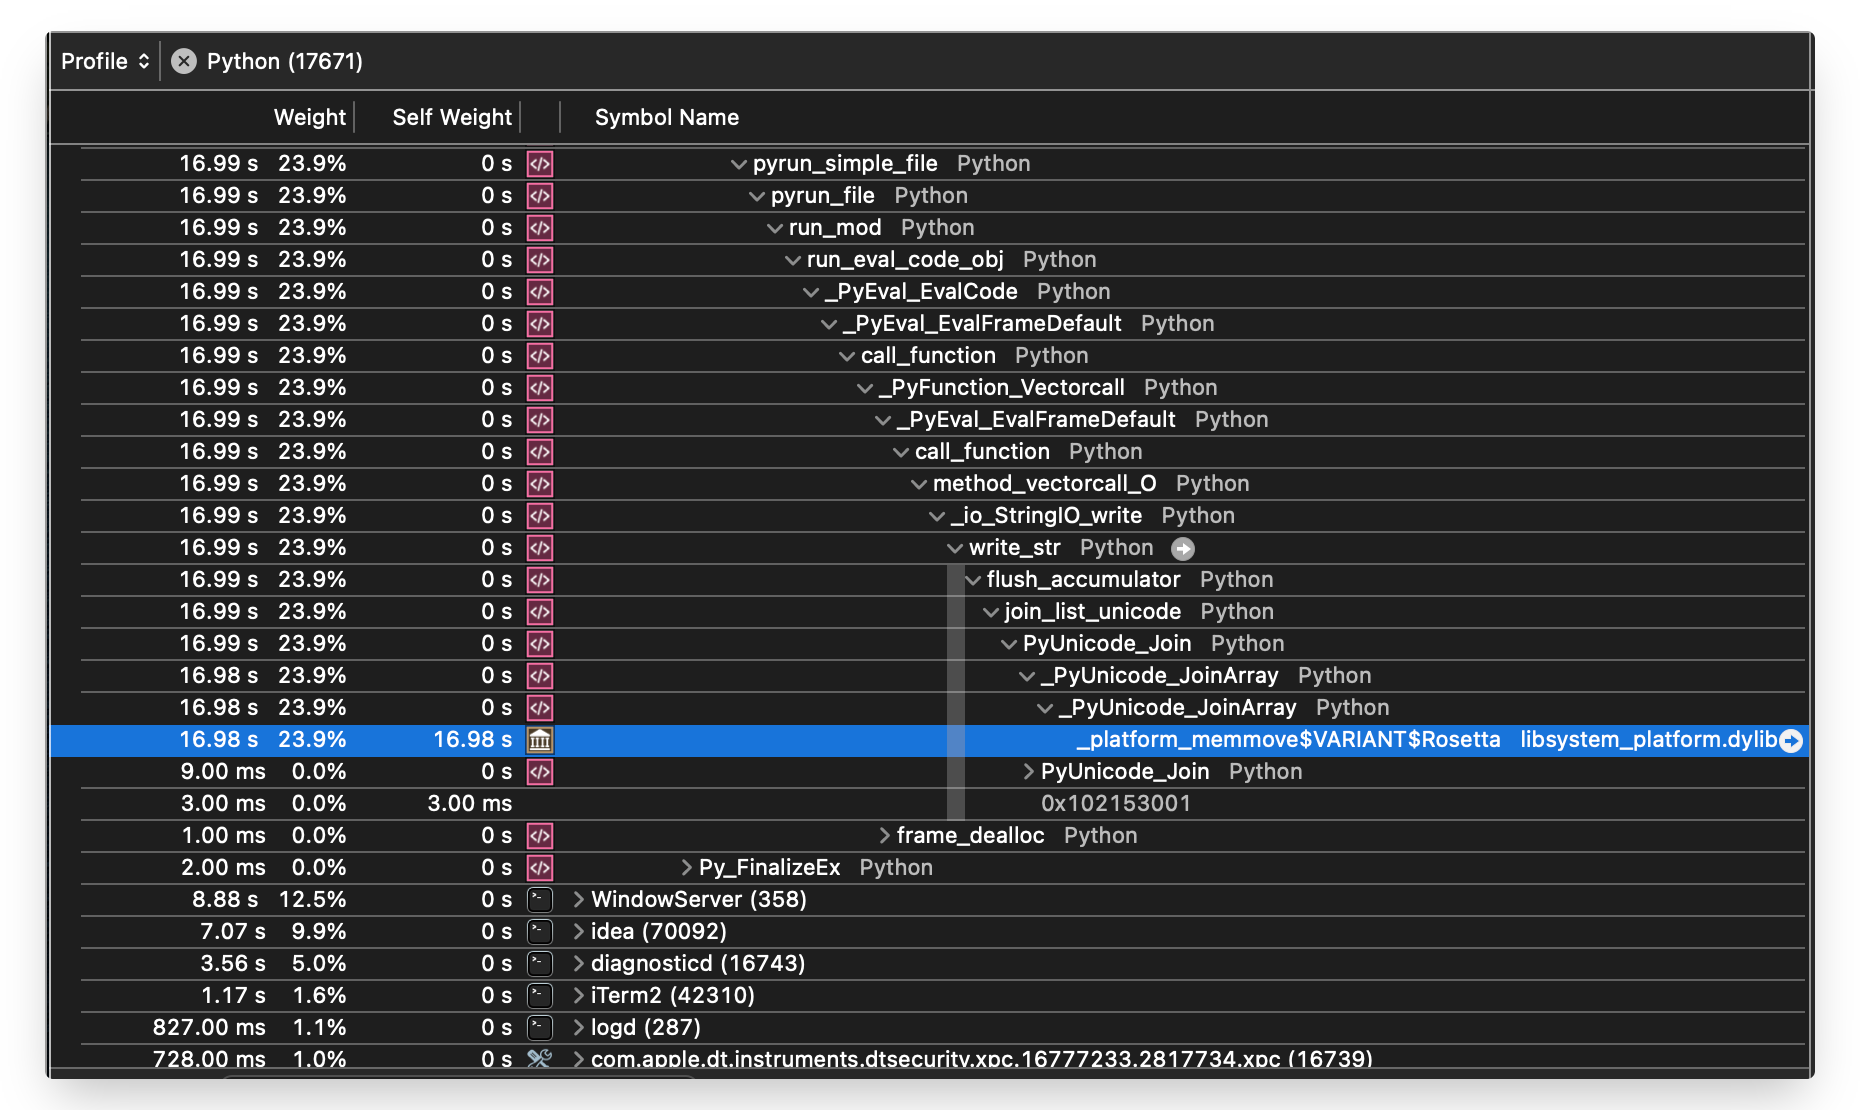
Here’s a rundown of the above callstack data:
- At the top we can see functions for running the
write_to_memory.pyfile. eg.pyrun_file _PyEval_EvalCodeis more or less the start of the Python interpreter loop.write_stris the internal C function dispatched to when the.write()method is called on the StringIO object.flush_accumulatorwas not present in profiles of fast runs, in particular the run that ‘writes’ 99GB to memory. In the image we can see this function is where the code snippet spends almost all its time._platform_memmove$VARIANT$Rosettais the ‘bottom’ of our investigation. It’smemmove, and doingmemmoveon 100GB of data is why the run is so slow.
It makes total sense that doing memmove on 100GB is slow. The scalene profiler was showing us in the COPY (MB/s) column that about 3.4GB of memory was being copied per second.
But that memory copying was only happening on the 100,000th .write(). When asking the snippet to write 99GB, which triggers 99,999 .write() operations, no significant memory copying happened at all. Why?
Looking up the flush_accumulator function in the CPython source code gives the answer.
The recently deceased accu.c module
The flush_accumulator function and its related code actually just got replaced 15 days ago (mid-July 2022), but until recently StringIO objects did ‘lazy writing’ of Unicode strings to their internal buffer with something called an accumulator. This accumulator functionality was in Objects/accu.c, and it contains the core function, _PyAccu_Accumulate:
int _PyAccu_Accumulate(_PyAccu *acc, PyObject *unicode)
{
    Py_ssize_t nsmall;
    assert(PyUnicode_Check(unicode));

    if (PyList_Append(acc->small, unicode))
        return -1;
    nsmall = PyList_GET_SIZE(acc->small);
    /* Each item in a list of unicode objects has an overhead (in 64-bit
     * builds) of:
     *   - 8 bytes for the list slot
     *   - 56 bytes for the header of the unicode object
     * that is, 64 bytes.  100000 such objects waste more than 6 MiB
     * compared to a single concatenated string.
     */
    if (nsmall < 100000)
        return 0;
    return flush_accumulator(acc);
}
Hard-coded right there is the magic 100000 number controlling the observed gaps between stalls! In order to avoid wasting memory building up many intermediate objects during creation of a StringIO’s buffer, StringIO’s .write() is lazy. It only accumulates references to the written object until it’s either forced to ‘realize’ the buffer – which can be triggered manually with .getvalue() – or if this magic number of “small” accumulations is reached.
// in cpython/Modules/stringio.c
if (self->state == STATE_ACCUMULATING) {
    if (self->string_size == self->pos) {
        if (_PyAccu_Accumulate(&self->accu, decoded))
            goto fail;
        goto success;
    }
    if (realize(self))
        goto fail;
}
We can quickly confirm this by modifying the snippet to spit out the reference count of the s string used to build up the 100GB of data, both before and after the buffer realization trigger. Before I show the modified snippet, here’s the confirming output:
$ python3 write_to_memory.py 100_000_000_000
's' var's reference count just before StringIO is realized: 100000
's' var's reference count after StringIO is realized: 1
And here’s the snippet:
import ctypes
import sys
from io import StringIO

CHUNK_SIZE = 1_000_000
s = "a" * CHUNK_SIZE

class CStructStruct(ctypes.Structure):
    _fields_ = [
        ("ob_refcnt", ctypes.c_long),
        ("ob_type", ctypes.c_void_p),
        ("ob_ptr", ctypes.c_long),
    ]

def f(NUMBER):
    output = StringIO()
    bytes_written = 0
    writes = 0
    cstruct_s = CStructStruct.from_address(id(s))
    while bytes_written < NUMBER:
        if writes + 1 == 100_000:
            print(
                f"'s' var's reference count just before StringIO is realized: {cstruct_s.ob_refcnt}"
            )
        output.write(s)
        bytes_written += CHUNK_SIZE
        writes += 1
    if writes > 100_000:
        print(f"'s' var's reference count after StringIO is realized: {cstruct_s.ob_refcnt}")

f(int(sys.argv[1]))
Fixing the code snippet
To fix the code snippet we can just call the output.getvalue() function after exiting the while loop, which forces the internal buffer to be realized if it hasn’t been already. Though I’d almost bet a house it won’t be merged, I’ve submitted that fix to website’s repo: #20. Avoid laziness of StringIO.write spoiling benchmark correctness.
This memory filling code snippet’s odd performance behavior wasn’t obvious initially, but with persistent digging computers can be understood.